- Published on
AI learning journey step 6 : Start instrumenting LLM calls with ML Flow
- Authors
- Name
- Ismail Tlemcani
- @Ismailtlem
An LLM endpoint can return HTTP 200 with an incorrect answer. Monitoring response status alone is not enough: we also need to understand how requests execute and assess the quality of their answers. This post covers the first steps in LLMOps—operating and monitoring LLM applications—using MLflow for tracing and evaluation.
What is LLM evaluation?
LLM evaluation checks whether an answer meets defined expectations. An exact text comparison is often too restrictive because several different answers can be acceptable.
There are three common approaches:
- Deterministic checks: validate JSON, required fields, or numeric constraints.
- Human review: manually assess correctness and usefulness.
- LLM-as-a-judge: ask a model to assess an answer against explicit criteria.
Useful criteria include relevance, compliance with system instructions, factual grounding in supplied evidence, and correct refusal of unsupported requests.
The evaluator needs context. Supplying the question, system prompt, and tool results helps it assess whether the answer followed instructions and used the available data. It cannot reliably verify application-specific facts from the answer alone.
An LLM judge can still make mistakes. Its assessment is feedback, not proof of correctness.
Evaluation can run inline, during an API request, or offline, against a dataset. Inline evaluation assesses new answers but adds latency and token usage. Offline evaluation helps compare prompt or model changes using consistent test cases.
What is tracing?
Tracing records how a request executes.
A trace represents the complete operation. A span represents an operation inside it, such as a model call. One chat request can contain several model-call spans.
Tracing helps explain slow requests, unexpected answers, and failures.
What does a trace capture?
With application tracing and SDK autologging, useful information includes:
| Information | Why it matters |
|---|---|
| Total duration | Measures the complete chat operation, including inline evaluation. |
| Model-call duration | Shows how long individual model calls take. |
| Input tokens | Measures tokens sent to the model: instructions, history, question, and tool results. |
| Output tokens | Measures tokens generated by the model. |
| Total tokens | Combines input and output usage for a call. |
| Status and errors | Identifies operations that failed. |
| Model and request parameters | Helps explain differences between executions. |
| Inputs and outputs | Shows what the model received and returned. |
Inputs and outputs are execution details rather than numerical metrics, but they are essential when investigating an answer.
Token fields depend on provider reporting and integration support. Cost reporting also depends on pricing support; token usage does not automatically guarantee an accurate monetary cost.
A root trace does not automatically explain every operation. Adding spans around tool execution or database queries provides more detailed timing.
What is MLflow?
MLflow is an open-source platform supporting LLM tracing, evaluation, and prompt management.
For these first steps, it provides a place to inspect requests and associate quality assessments with their execution traces.
Set up MLflow locally
First, install MLflow:
pip install mlflow==3.18.0
Start the local server:
mlflow server --host 127.0.0.1 --port 5000
The MLflow interface is available at http://127.0.0.1:5000.
If your API runs in a separate Python environment, install the lightweight client there:
pip install mlflow-skinny==3.18.0
Also add these environment variables to your API environment:
MLFLOW_TRACKING_URI=http://127.0.0.1:5000
MLFLOW_EXPERIMENT_NAME=my-llm-app
The tracking URI tells the application where to send traces. The experiment name groups related executions.
Configure MLflow in your code
After setting the environment variables, initialize MLflow once when your application starts:
import os

import mlflow

mlflow.set_tracking_uri(os.environ["MLFLOW_TRACKING_URI"])
mlflow.set_experiment(os.environ["MLFLOW_EXPERIMENT_NAME"])
mlflow.openai.autolog()
mlflow.tracing.enable()
set_tracking_uri selects the server receiving tracking data. set_experiment selects or creates the experiment used to group traces.
mlflow.openai.autolog() automatically instruments supported OpenAI SDK calls. For a different SDK, use its corresponding MLflow integration.
You can also trace application functions explicitly:
@mlflow.trace(name="chat")
def answer_question(question: str) -> str:
Here is what we did in DarIndex:
@mlflow.trace(name="chat")
def ask(self, question: str) -> str:
    ...
The decorator records the complete chat operation. Autologging captures supported model calls inside it.
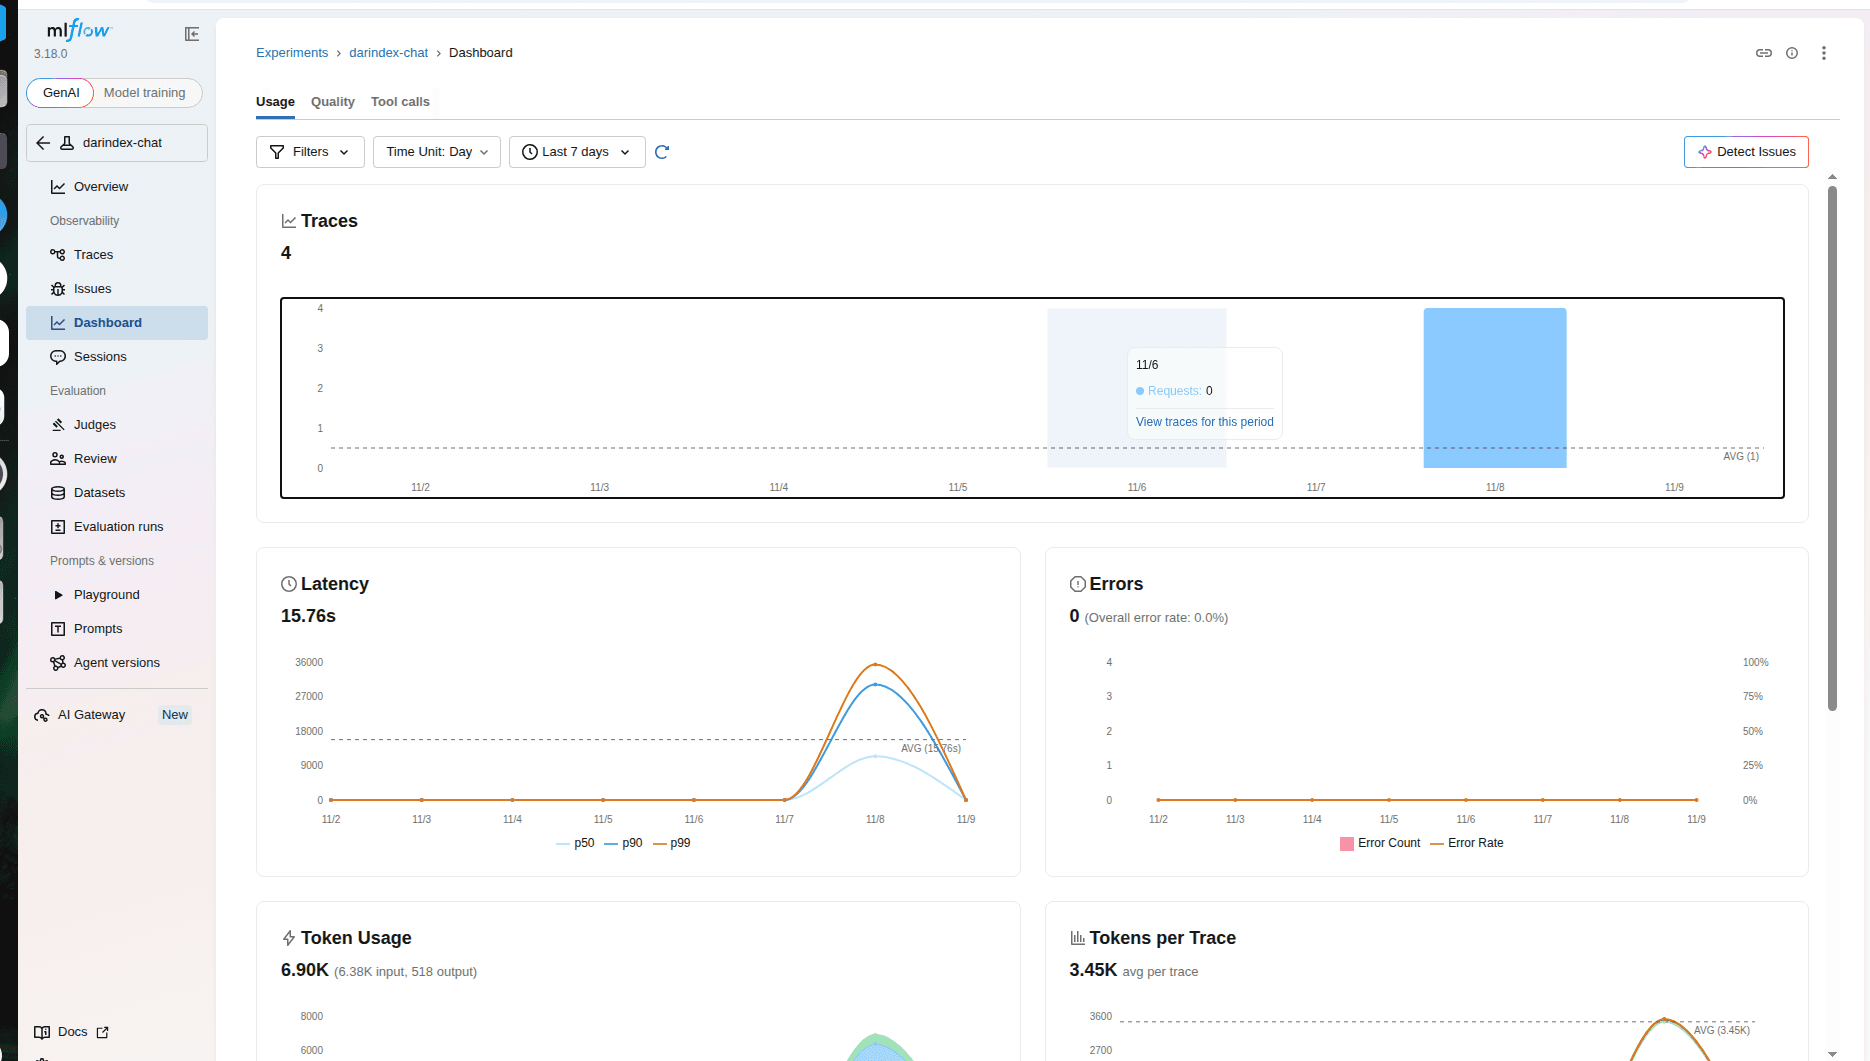
Evaluate completed answers
Darindex uses MLflow’s Guidelines scorer. This simplified example follows the implementation; judge_model represents the configured evaluator model URI:
from mlflow.genai.scorers import Guidelines

feedback = Guidelines(
    name="chat_quality",
    guidelines=[
        "Address the user's question clearly.",
        "Follow the supplied system prompt.",
        "Support factual claims with the supplied tool results.",
        "Refuse unsupported requests according to the policy.",
    ],
    model=judge_model,
)(
    inputs={
        "question": question,
        "system_prompt": system_prompt,
        "tool_results": tool_results,
    },
    outputs=answer,
)
This produces one combined chat_quality assessment with a rationale, not separate scores for every criterion.
The service attaches the result to the active trace:
mlflow.log_feedback(
    trace_id=span.trace_id,
    name=feedback.name,
    value=feedback.value,
    rationale=feedback.rationale,
)
Evaluation runs before returning completed answers, including deterministic refusals, when tracing is active. If judging fails, the original answer is preserved. The assessment does not filter or rewrite it.